
Visualising Multivariate Categorical Data
Date:
Quick links: paper, poster, preview video, supplementary figure
Recommended citation: Trye, D. (2022, April 11-14). Visualising multivariate categorical data [Poster presentation]. 2022 IEEE 15th Pacific Visualization Symposium (PacificVis), Tsukuba, Japan. https://dgt12.github.io/files/pvis22_paper.pdf
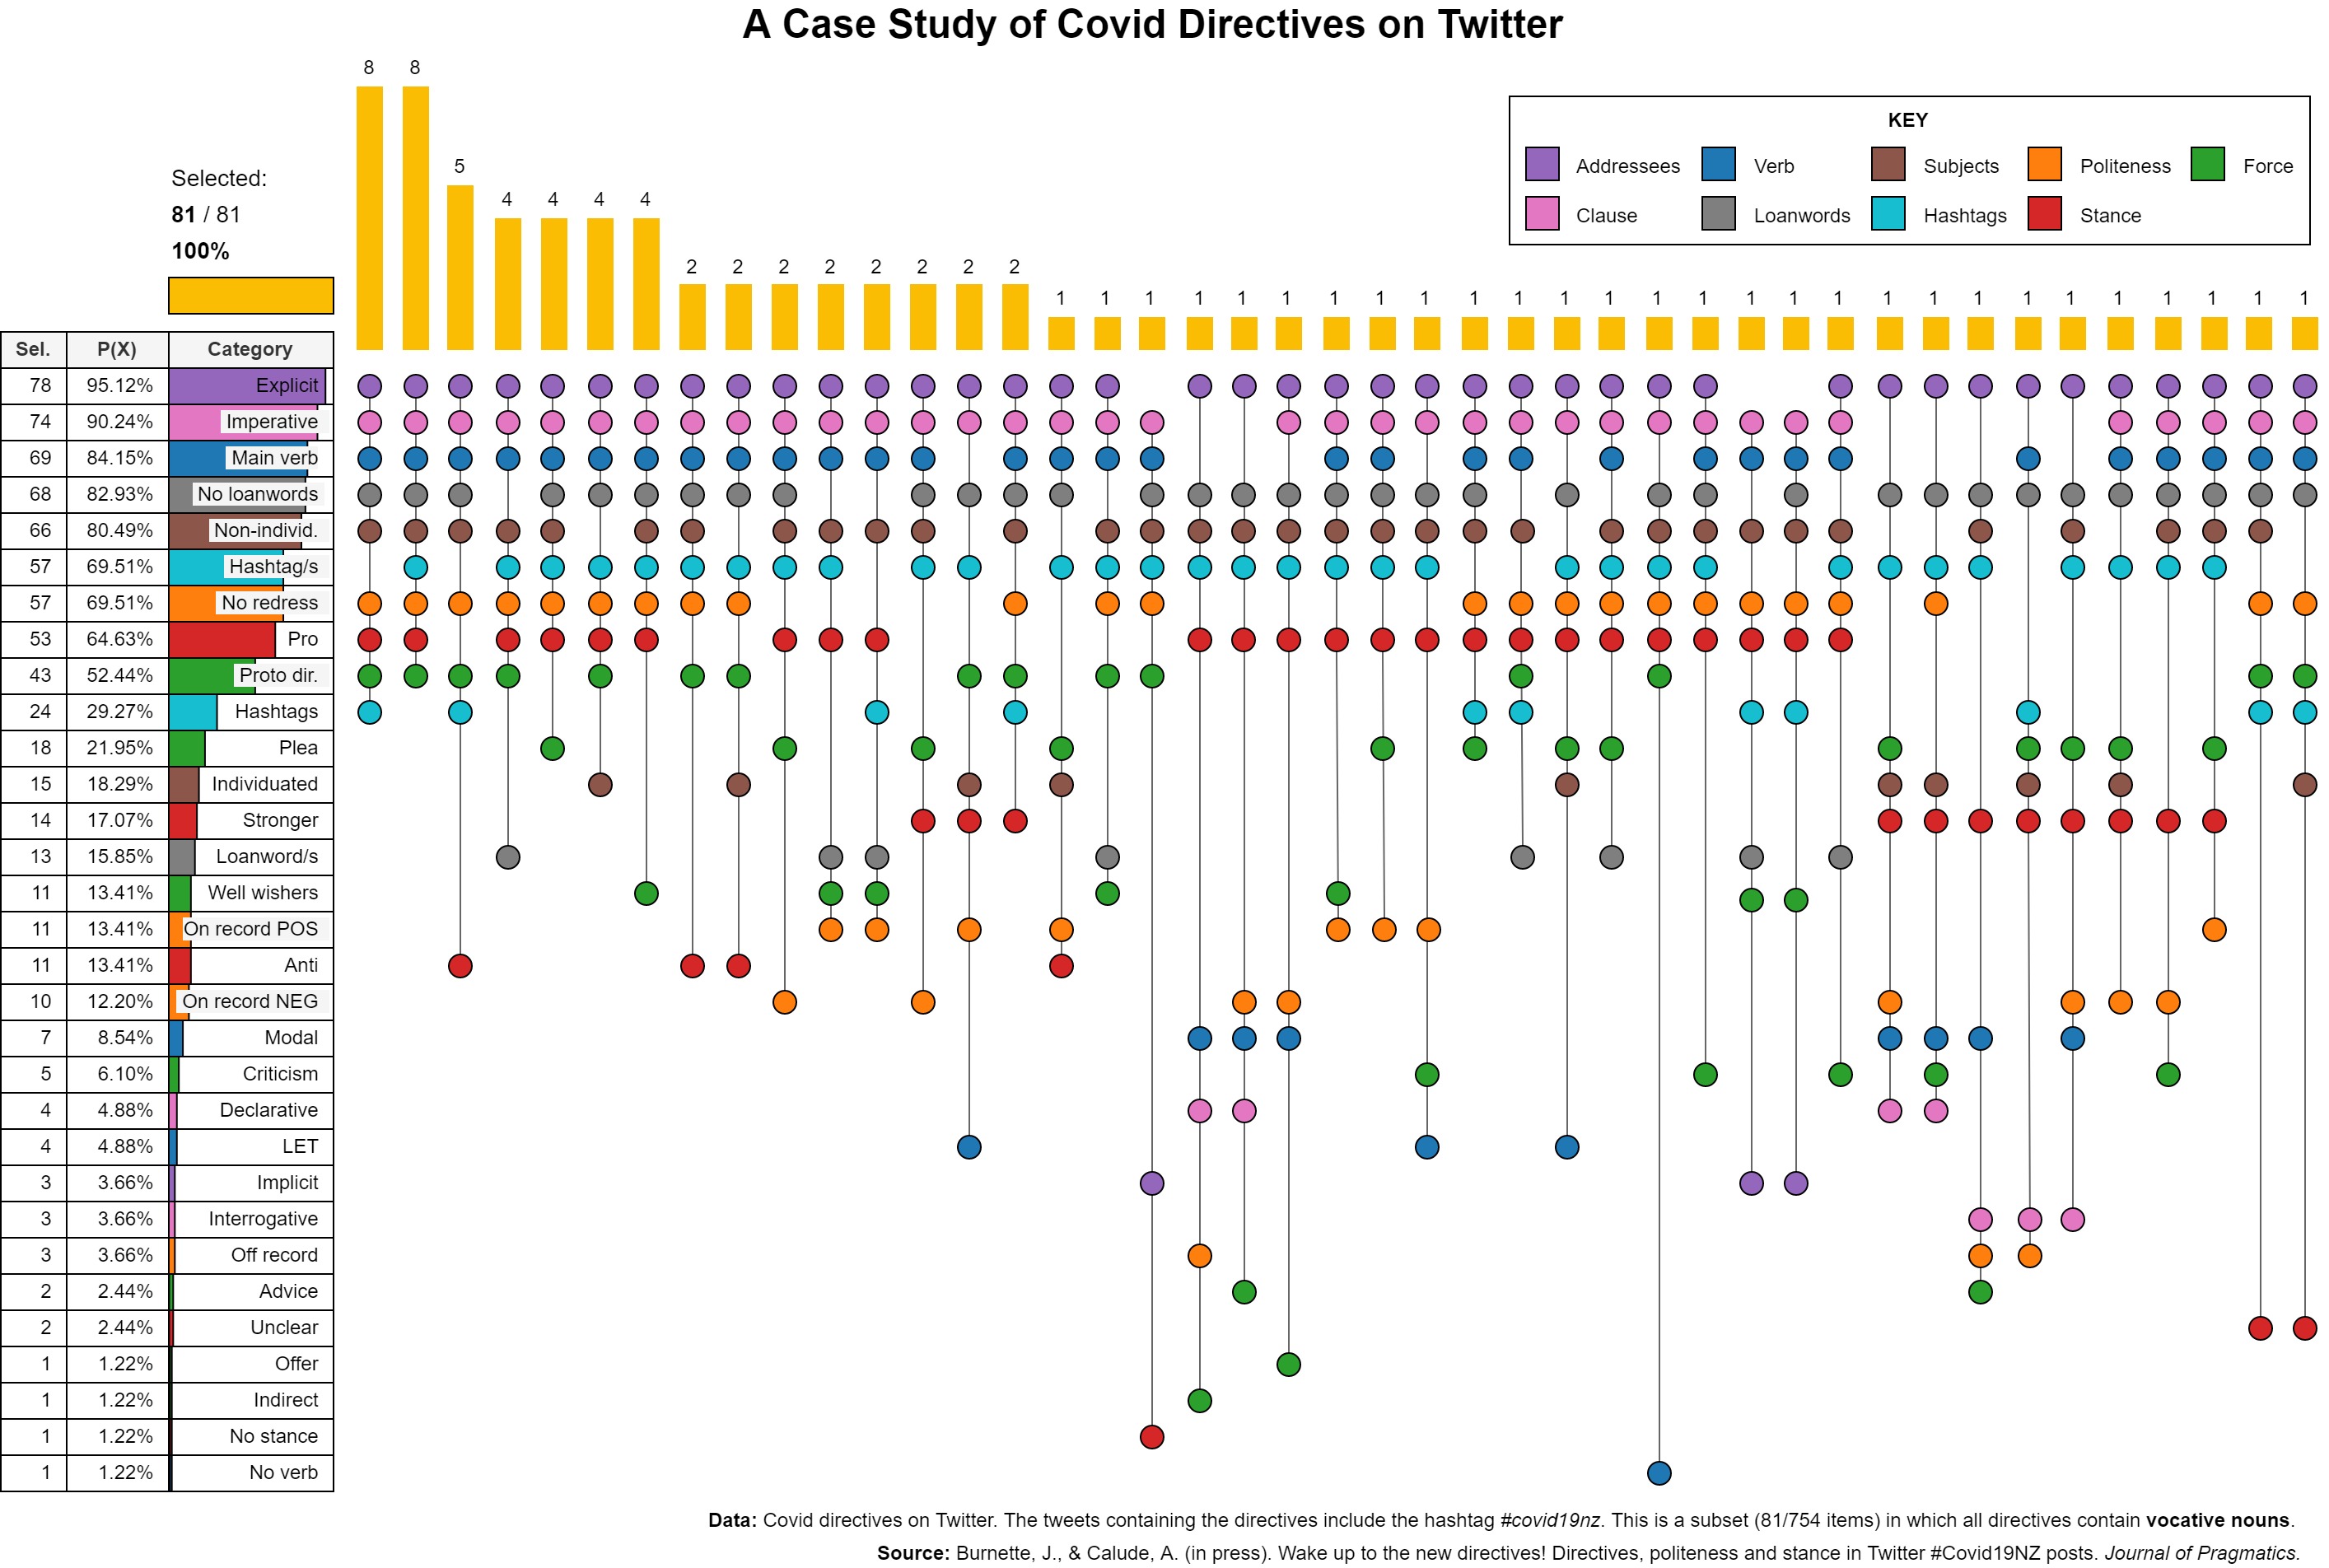
Despite categorical dimensions being common in real-world datasets, few visualisation techniques support the analysis of multiple categorical variables at the same time. Those methods that do exist do not scale well, or do not consider relationships between all variables simultaneously, instead breaking them down into more restricted views or reflecting a hierarchy of variables. Drawing inspiration from set-based tools, this paper introduces a novel technique for visualising multivariate categorical data, by aggregating different combinations of categories. Advantages of this approach include the ability to easily compare frequencies among both variable categories and their combinations, the absence of line crossings, and a non-hierarchical layout that does not privilege one variable above all others.